
Exploring U.S. Parks
A Data-Driven Visual Representation

Houston ParkScore® Ranking
The ranking for Houston is based on how it compares nationally on five characteristics of an excellent park system: access, investment, acreage, amenities, and equity.
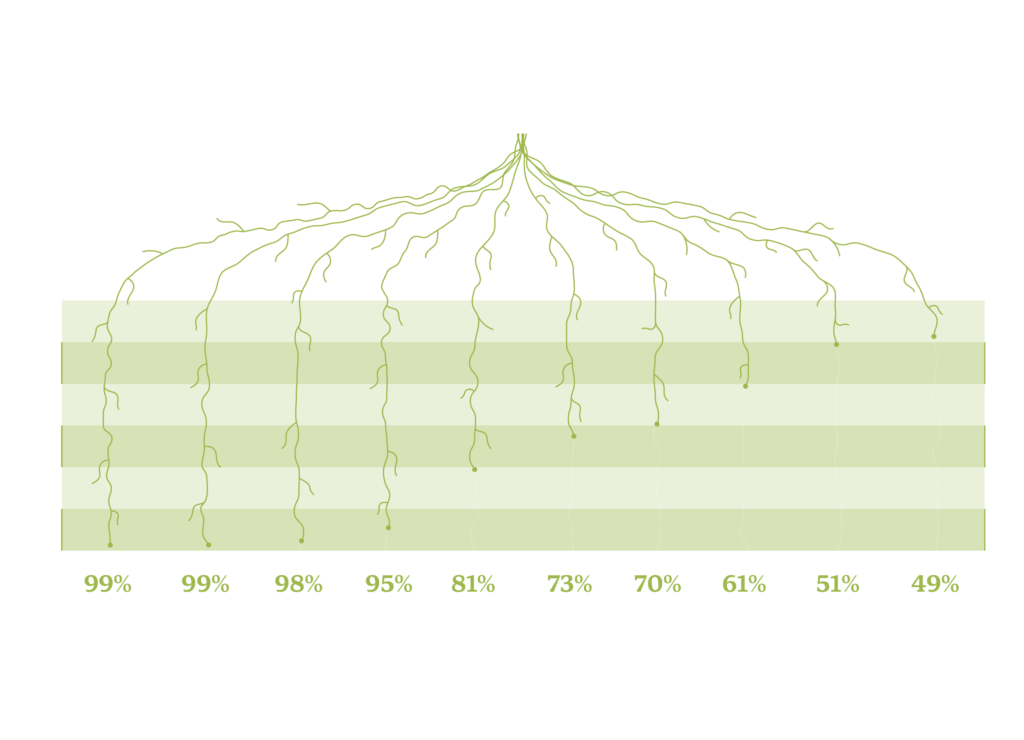
Acreage: Parkland as
Percent of City Area
Largest U.S. Cities By Population
The ParkScore index awards each city up to 100 points for acreage based on the average of two equally weighted measures: median park size and parkland as a percentage of city area. Factoring park acreage into each city’s ParkScore rating helps account for the importance of larger “destination parks” that serve many users who live farther than ten minutes’ walking distance.
Los Angeles
Chicago
Dallas
Access: Residents
within a 10-Minute
Walk to Park (%)
Largest U.S. Cities By Population
The ParkScore index awards each city up to 100 points for access based on the percentage of the population living within a 10-minute (half-mile) walk of a public park. For each park, a 10-minute walkable service area was created using a nationwide walkable road network dataset provided by Esri. The analysis identifies physical barriers such as highways, train tracks, and rivers without bridges and chooses routes without barriers.
Investment: Spending
Per Resident
Largest U.S. Cities By Population
The ParkScore index awards each city up to 100 points for access based on the percentage of the population living within a 10-minute (half-mile) walk of a public park. For each park, a 10-minute walkable service area was created using a nationwide walkable road network dataset provided by Esri. The analysis identifies physical barriers such as highways, train tracks, and rivers without bridges and chooses routes without barriers.
Public spending: This includes capital and operational spending by all public agencies that own or manage parkland within the city limits, including federal, state, and county agencies. These figures only reflect agency spending on parks and recreation, however, and do not reflect the significant spending in other capacities that some park agencies are responsible for throughout their cities.
Nonprofit spending: This includes all spending by parks nonprofits, conservancies, foundations, and “friends of” groups that work locally to improve a city’s parks. This information is collected through an annual survey of these groups and through filed Forms 990.
Volunteer hours: This includes both hours worked for any public parks and recreation agency as well as through the above non-profit organizations. These hours are then monetized according to the Independent Sector’s Value of Volunteer Time report, using the dollars per hour value for each state.